You may know RackNet supports collecting temperature, humidity, and light data for any room — even rooms without racks. But did you know you can visualize temperature, humidity, and light data, as well as download it for import into other applications?
Monitoring environmental conditions like temperature, humidity, and light is critical for optimizing any space—whether it’s a data center, a server room, or a facility containing Innovive Innoracks. With RackNet, you can do more than just collect this data; you can transform it into clear, actionable visualizations to spot trends, ensure optimal conditions, and make informed decisions. Plus, easily download your data for use in other applications. In this post, we’ll guide you through how to access, customize, and explore these powerful visualizations to get the most out of your RackNet service.
Preparing for inspection? RackNet’s temperature, humidity, and light visualizations make compliance effortless. With detailed data logs, exportable in CSV format, and customizable views of environmental trends, you can provide inspectors with clear, accurate records.
Access the data for the desired room, then perform these steps:
- Choose the time period
- Confirm the data with the chart produced
- Print or download the chart
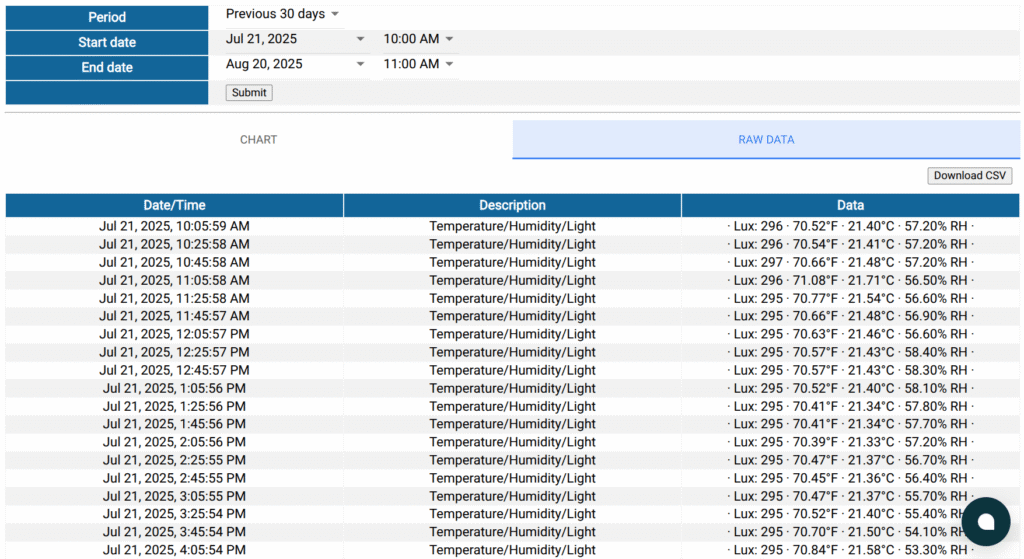
If you would like to export the data for additional processing:
- View the raw data for the selected time period
- Use the “Download CSV” button to initiate the data download
Accessing data
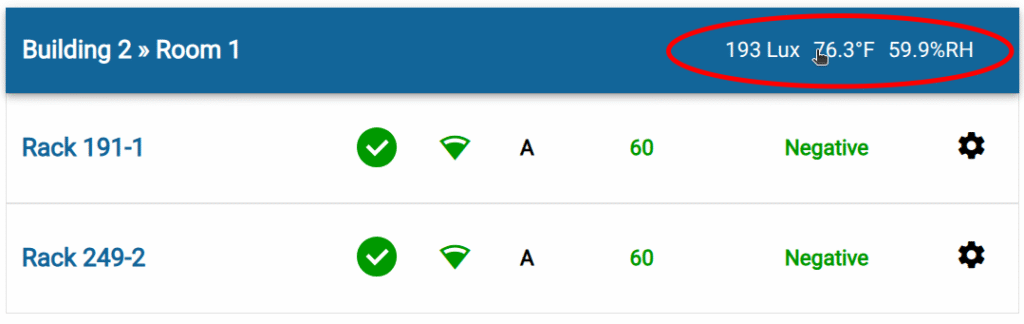
From the main racks list, simply click on the data values in any room heading:
You will be taken a view of the past 24 hours worth of data:
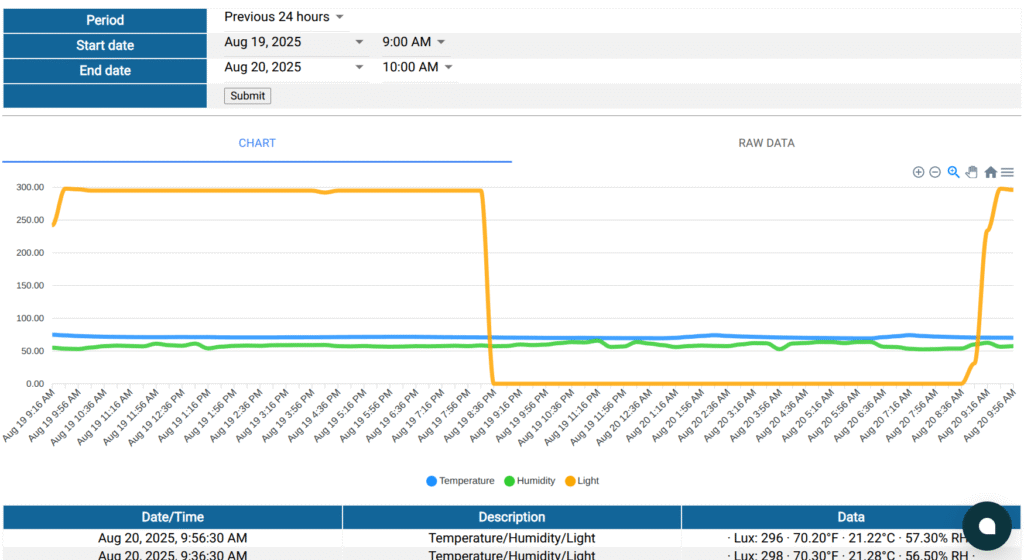
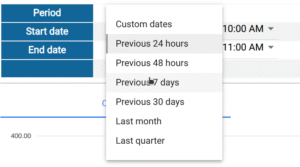
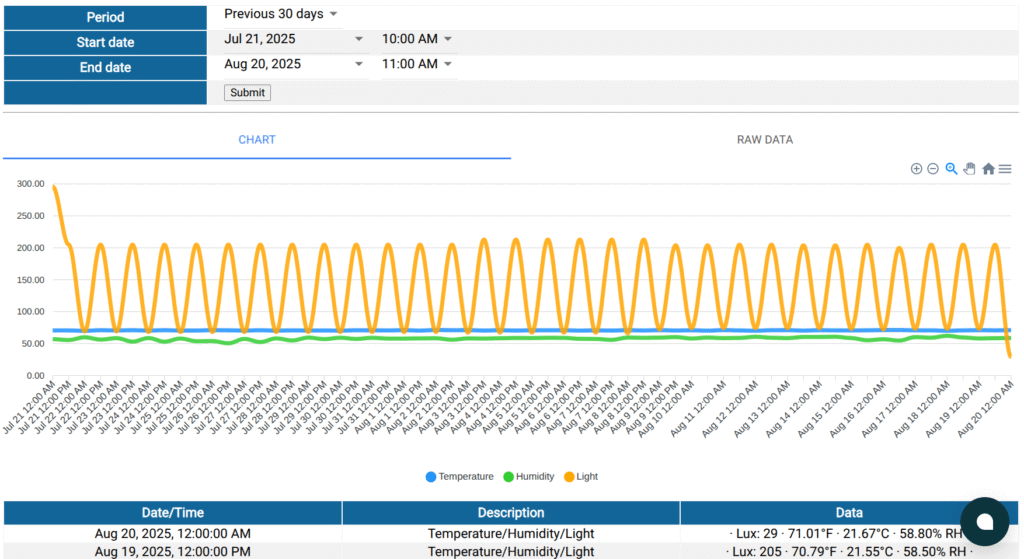
Customize your view of the data
Select the date/time period from a list of presets or select custom dates and times. Preset time periods are:
- Previous 24 hours
- Previous 48 hours
- Previous 7 days
- Previous 30 days
- Last month
- Last quarter
Additional chart features
- Hover any data point to view the values at that time
- Use the controls in the upper right of the chart to zoom in, zoom out, and return to the “home” view
- Select a range of data points with the cursor to zoom in on a specific range of values
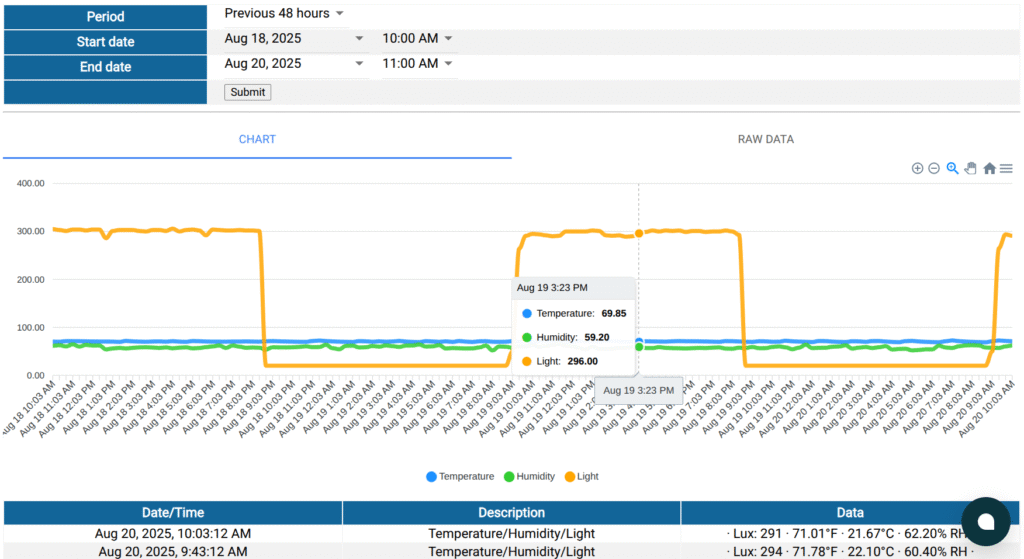
Patterns become clear as you “zoom out” to a longer time period:
Download the data
To download the data, click the RAW DATA tab, then hit the “Download CSV” button.
A brief demonstration
Below is a demonstration of the temperature, humidity, and light data in RackNet:
- Scroll down to view a list of data points depicted in the chart
- Select a different time period from the list of period presets
- Hover over any data point to view the values
- View all the raw data and download it in CSV format
Meet AAALAC Inspection Standards
The Guide for the Care and Use of Laboratory Animals (8th Edition) emphasizes consistent temperature and humidity monitoring to ensure animal welfare and research integrity. RackNet’s real-time data, customizable visualizations (e.g., 24-hour to 30-day views), and exportable CSV files make it easy to maintain and present records during AAALAC or USDA inspections. Track microenvironmental trends, address deviations proactively, and ensure compliance with the Guide’s standards.